
Loss measures for Halloween and non-Halloween fires (3-year average, 2017‑2019)
The average number of fatalities per 1,000 Halloween fires was slightly higher than the same loss measures for all other fires, while the average number of injuries per 1,000 Halloween fires was lower than for all other fires. The average dollar loss per Halloween fire was also higher than per non-Halloween fire. 2
| Loss measure | Halloween fires (Oct. 30- Nov. 1) | Non-Halloween fires |
|---|---|---|
| Fatalities/1,000 fires | 2.6 | 2.4 |
| Injuries/1,000 fires | 9.0 | 9.7 |
| Dollar loss/fire | $13,690 | $11,860 |
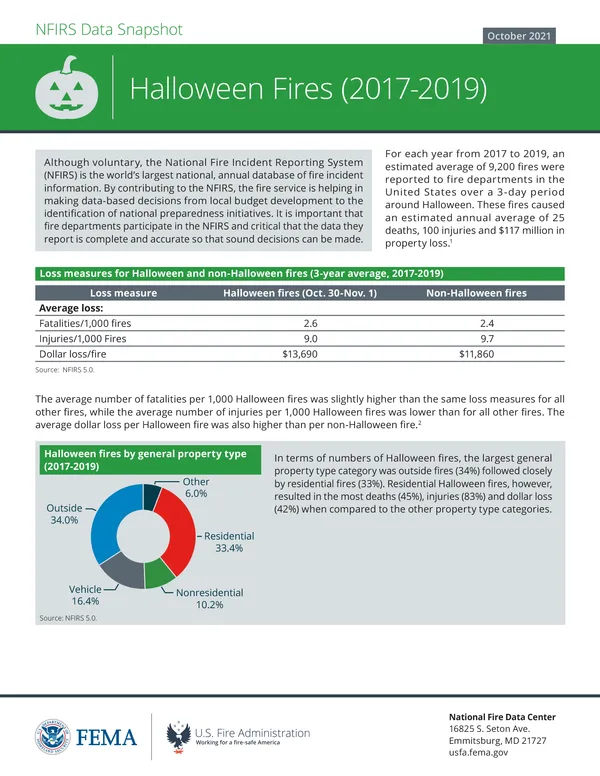
Halloween fires by general property type (2017‑2019)
In terms of numbers of Halloween fires, the largest general property type category was outside fires (34%) followed closely by residential fires (33%). Residential Halloween fires, however, resulted in the most deaths (45%), injuries (83%) and dollar loss (42%) when compared to the other property type categories.
Source: NFIRS 5.0
Halloween fires by time of alarm (2017‑2019)
Halloween fires occurred most frequently in the afternoon and early evening hours, peaking from 6 to 7 p.m. Fires then declined, reaching the lowest point during the early morning from 3 to 6 a.m.
Source: NFIRS 5.0
Table may not total 100 percent due to rounding.
Table may not total 100 percent due to rounding.
What causes most Halloween fires?
The leading causes of residential Halloween fires were cooking (49%); heating (12%); other unintentional, careless actions (8%); and electrical malfunctions (8%).
Source: NFIRS 5.0
| 51.8% | Cooking | |
| 8.9% | Heating | |
| 7.5% | Unintentional, careless | |
| 6.3% | Electrical malfunction |


Public service announcement: Halloween safety tips
Source: U.S. Consumer Product Safety Commission
Candle flames and flammable costumes can be a dangerous combination. Share these safety tips with your community to ensure that Halloween is a safe holiday for everyone.
More information about Halloween fire safety
- Halloween fires are defined as fires that occurred on Oct. 30, Oct. 31 and Nov. 1. Fires are defined by Incident Types 100-173 (all fires excluding Incident Type 110). Aid Types 3 (mutual aid given) and 4 (automatic aid given) were excluded to avoid counting a single incident more than once. Estimates of fires are rounded to the nearest 100, deaths to the nearest 5, injuries to the nearest 25, and losses to the nearest million.
- The average loss measures computed from the raw NFIRS data in the table differ from the average loss measures computed from national estimates. The fire death rate computed from national estimates is (1,000 x (25/9,200)) = 2.7 deaths per 1,000 Halloween fires, and the fire injury rate is (1,000 x (100/9,200)) = 10.9 injuries per 1,000 Halloween fires. Average loss for fatalities and injuries is computed per 1,000 fires. Average dollar loss is computed per fire and rounded to the nearest $10. The 2017 and 2018 dollar-loss values were adjusted to 2019 dollars.