
Loss measures for Thanksgiving Day and non-Thanksgiving Day fires in residential buildings (3-year average, 2017‑2019)
The average number of reported residential building fires on Thanksgiving Day was more than double (2.3 times more) the average number of fires in residential buildings on all other days. The average losses for these fires, however, were less than the same measures for non-Thanksgiving Day fires in residential buildings.2
| Loss measure | Thanksgiving Day fires | Non-Thanksgiving Day fires |
|---|---|---|
| Fatalities/1,000 fires | 1.9 | 6.2 |
| Injuries/1,000 fires | 11.1 | 25.2 |
| Dollar loss/fire | $9,570 | $18,770 |
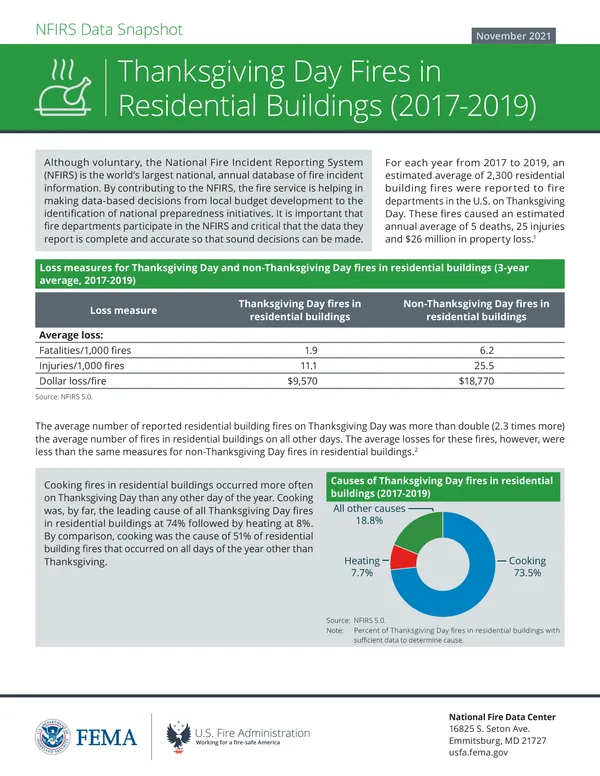
What causes most Thanksgiving Day fires in residential buildings?
Cooking fires in residential buildings occurred more often on Thanksgiving Day than any other day of the year. Cooking was, by far, the leading cause of all Thanksgiving Day fires in residential buildings at 74% followed by heating at 8%. By comparison, cooking was the cause of 51% of residential building fires that occurred on all days of the year other than Thanksgiving.
Source: NFIRS 5.0.
Thanksgiving Day fires in residential buildings by time of alarm (2017‑2019)
Over half (54%) of Thanksgiving Day fires in residential buildings occurred from 10 a.m. to 5 p.m., when many people are preparing Thanksgiving dinner. Fires then declined throughout the evening. This stands in contrast to the rest of the year, when residential building fires peaked during “normal” dinnertime hours of 5 to 8 p.m.
Source: NFIRS 5.0.
Table may not total 100 percent due to rounding.
Table may not total 100 percent due to rounding.
Extent of fire spread in Thanksgiving Day fires in residential buildings
In 75% of Thanksgiving Day fires in residential buildings, the fire was limited to the object of origin. An additional 11% of these fires were limited to the room of origin. The remaining 14% of Thanksgiving Day fires in residential buildings extended beyond the room of origin. Annually among all other residential building fires, 56% were limited to the object of origin, an additional 19% were limited to the room of origin, and the remaining 25% extended beyond the room of origin.
Source: NFIRS 5.0.
| 75.45% | Limited to object of origin | |
| 11.02% | Limited to room of origin | |
| 2.55% | Limited to floor of origin | |
| 9.33% | Limited to building of origin | |
| 1.65% | Beyond building of origin |
Thanksgiving Day fires in residential buildings by general property type
(2017-2019)
Most Thanksgiving Day fires in residential buildings took place in 1- and 2-family dwellings (60%) followed by multifamily dwellings (33%). This is fairly comparable to non-Thanksgiving Day fires in residential buildings, with 1- and 2-family dwellings at 63%, multifamily dwellings at 29%, and other dwellings at 9%. 3
Source: NFIRS 5.0.
Social media images to share
Share these Thanksgiving fire safety tips on your Facebook timeline or Twitter feed.
Directions: Click on or touch an image below to display its full size and save it to your device.


Cooking fire safety
Cooking is the leading cause of home fires and home fire injuries. Teach community members to cook safely by giving them information about cooking fire risks and how to prevent cooking fires.
How dangerous are turkey fryers?
Source: U.S. Consumer Product Safety Commission
Watch this 6 second video to see what a turkey fryer explosion looks like.
- Thanksgiving Day fires are defined as fires that occurred on Nov. 23, 2017, Nov. 22, 2018, and Nov. 28, 2019. Estimates of fires are rounded to the nearest 100, deaths to the nearest 5, injuries to the nearest 25, and losses to the nearest million. Sources: NFIRS and the National Fire Protection Association.
- The average loss measures computed from the raw NFIRS data in the loss measures table will differ from the average loss measures computed from national estimates. The fire death rate computed from national estimates is (1,000 x (5/2,300)) = 2.2 deaths per 1,000 Thanksgiving Day fires in residential buildings, and the fire injury rate is (1,000 x (25/2,300)) = 10.9 injuries per 1,000 Thanksgiving Day fires in residential buildings. Average loss for fatalities and injuries is computed per 1,000 fires. Average dollar loss is computed per fire and rounded to the nearest $10. The 2017 and 2018 dollar-loss values were adjusted to 2019 dollars.
- Total does not add up to 100% due to rounding.